A machine learning tutorial breaks down six foundational concepts using a classic income-prediction dataset of 32,561 people. The author builds a working model that reaches 84 percent accuracy while teaching why overfitting (memorizing training noise) and underfitting (being too simple) are the central trade-off every ML practitioner must navigate. The baseline is 76 percent—what you get if you predict everyone earns $50,000 or less—so any useful model must beat that floor.
Summaries like this, in your inbox every morning.
Sign up free →What happened
A tutorial walks through foundational machine learning concepts using the UCI Adult Census Income dataset (32,561 rows), building a model that reaches 84 percent accuracy on the binary task of predicting whether someone earns more than $50,000 per year.
Why it matters
The piece illustrates why naive baselines matter—a model that always predicts the majority class achieves 76 percent accuracy without learning anything—and how two opposite pitfalls (overfitting and underfitting) undermine real models. Understanding these trade-offs is essential for anyone building production ML systems.
What to watch
The tutorial demonstrates the gap between training and test performance as the key diagnostic: a deep decision tree (max_depth=15) reaches 85.8 percent on training but only 83.8 percent on test (a 2 percentage point gap signaling overfitting), while a shallow stump (max_depth=1) scores 80.2 percent on training and 80.5 percent on test, showing both are low (underfitting).
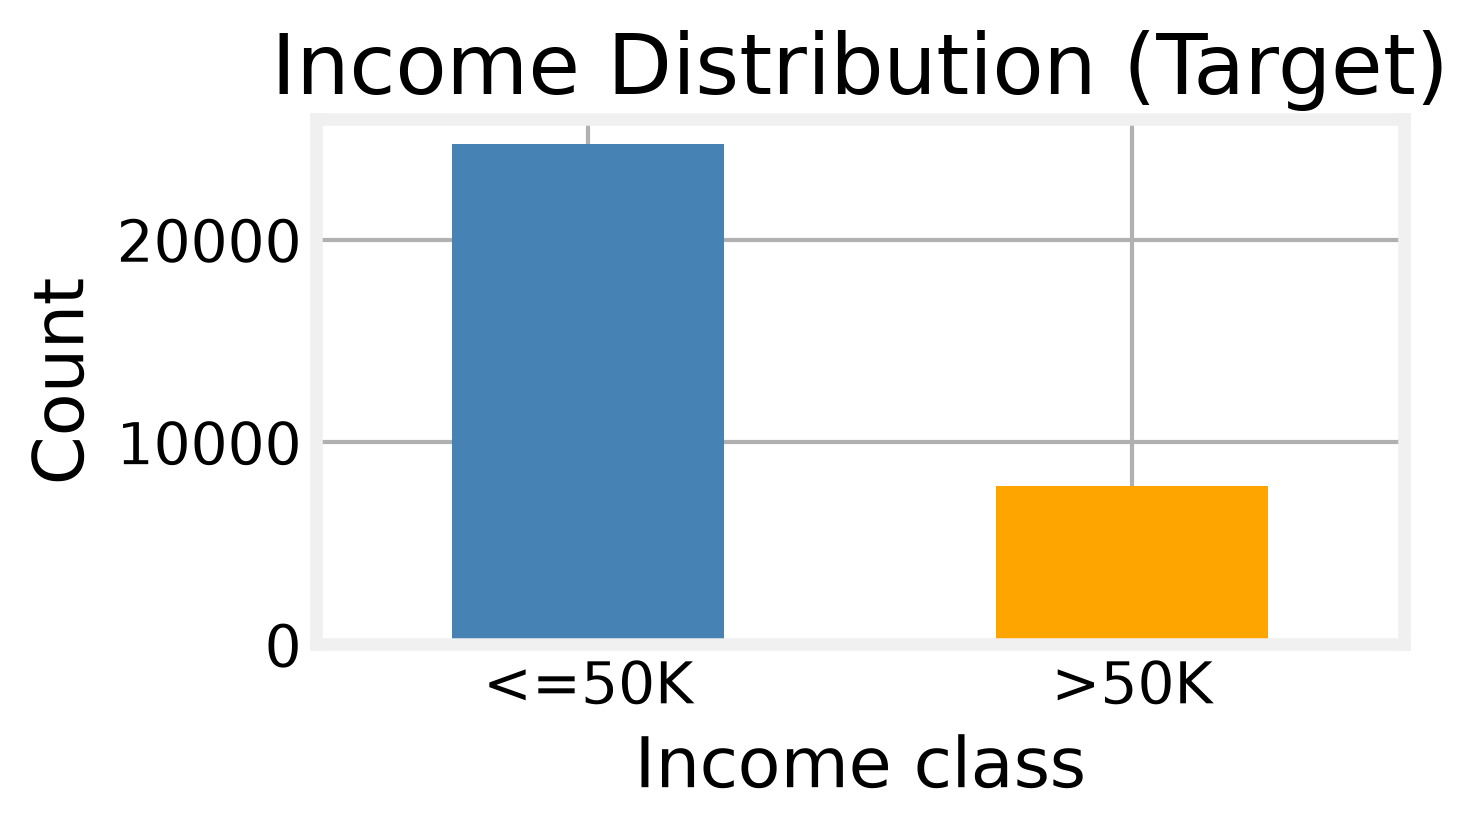
The tutorial begins with the Adult Census Income dataset, a classic binary classification benchmark containing 32,561 rows after removing duplicates and the fnlwgt sampling weight column. Each row describes a person through 14 features including age, education, occupation, and hours worked per week, with a target indicating whether the person earns more than $50,000 per year. The dataset's class distribution is imbalanced: approximately 76 percent of people earn $50,000 or less, and 24 percent earn more.
This imbalance immediately teaches a foundational lesson. A model that always predicts the majority class—"earn $50,000 or less"—achieves 76 percent accuracy without learning any pattern at all. The author calls this the floor: any useful model must beat 76 percent. Inspecting the numeric features (age, education level, capital gains, capital losses, hours per week) reveals reasonable distributions, though capital_gain shows a long tail. A correlation heatmap confirms that no pair of numeric features is strongly correlated, so multicollinearity is not a concern for simple models.
The tutorial then illustrates two opposite failure modes. A deep decision tree with max_depth=15 demonstrates overfitting: it reaches 85.8 percent accuracy on the training set but only 83.8 percent on the test set, a gap of two percentage points. The model has memorized quirks specific to the training data—certain combinations of age and capital gain that correlate with income in the sample but not in the general population—rather than learning the underlying signal. As the tree grows deeper, it increasingly chases noise.
Underfitting is shown by a shallow decision stump (max_depth=1). This stump scores 80.2 percent on training and 80.5 percent on test—both barely above the 76 percent baseline. The model learned a single rule (probably something about education or hours worked) and stopped, never discovering the richer interactions that separate high earners from low earners. While the gap between train and test is small, the diagnostic is clear: both scores are too low. By the time the tutorial finishes, the working model reaches 84 percent accuracy, but more importantly, the reader understands why simpler models fail and how to recognize the trade-off between overfitting and underfitting.
The tutorial frames machine learning as a discipline grounded in a handful of foundational principles, then uses a real dataset to make those principles concrete. The UCI Adult Census Income dataset is chosen because its class imbalance (76% vs. 24%) immediately teaches a critical lesson: a naive classifier that always predicts the majority class hits 76 percent accuracy without learning anything. This baseline is the floor every real model must beat, establishing why model selection and complexity control matter.
The two core pitfalls—overfitting and underfitting—are presented as opposing extremes along a single spectrum. Overfitting is demonstrated by a deep decision tree that learns spurious correlations in the training data (specific combinations of age and capital gain that correlate with income in the sample but not in the population), resulting in a 2 percentage point gap between training (85.8%) and test performance (83.8%). Underfitting is shown by a single-node decision stump that captures only a broad rule (probably education or hours worked) and fails to discover the richer interactions that distinguish high earners from low earners, leaving both training and test scores barely above the baseline. The tutorial's insight is that this gap—or lack thereof—is the diagnostic signal: large gaps signal overfitting; small gaps with both scores low signal underfitting.
AI-summarized, only the topics you pick — one digest a day via Email, Slack, or Discord.
Free · takes 30 seconds · unsubscribe anytime
No discussion yet for this article
Get curated AI news from 200+ sources delivered daily to your inbox. Free to use.
Get Started FreeFree · takes 30 seconds · unsubscribe anytime
1 minute a day. The AI essentials.
200+ sources · Email / LINE / Slack