The S&P 500 has delivered exceptional returns—up 10% this year and 24%, 23%, and 16% over the past three years—but valuations measured by the Shiller CAPE ratio have reached 42, a level previously seen only before the 2000 tech bubble burst.
At the same time, the tech sector represents roughly 40% of the index and the top 10 holdings make up nearly 40%, creating unprecedented concentration risk.
While the forward price/earnings ratio of 21 suggests reasonable pricing by some metrics, the combination of high valuations and heavy tech weighting means the index is vulnerable to sharp declines if market conditions shift or if major holdings stumble.
What happened
The S&P 500 has returned 24%, 23%, and 16% over the past three years and is up 10% this year. However, the Shiller CAPE ratio—which adjusts for inflation over 10 years—has reached 42, a level seen only once before in history during the lead-up to the 2000 tech bubble. The tech sector now accounts for roughly 40% of the index, and the top 10 holdings alone represent nearly 40%, an unprecedented concentration level.
Why it matters
While the forward price/earnings ratio of 21 suggests stocks are reasonably priced by some measures, the Shiller CAPE ratio warns that considerable optimism is already priced in after a three-plus-year bull market with few interruptions. The heavy concentration in tech and the top 10 companies means S&P 500 ETF performance is heavily influenced by just a handful of names, creating potential for sharp declines if any major holding falters.
What to watch
Investors concerned about both valuation and concentration risk may consider alternatives like the Invesco S&P 500 Equal Weight ETF (RSP), which has a forward P/E ratio of only 17 and spreads risk across five sectors with at least 9% weighting each, reducing individual company risk significantly.
Ask the AI about this article →
The S&P 500's three-year rally—returning 24%, 23%, and 16% annually, plus another 10% this year—has been driven substantially by gains in a narrow group of tech-heavy companies. This concentration reflects the outsized returns from artificial intelligence–related stocks, which have benefited from investor enthusiasm about AI's commercial potential. However, the article signals that this rally may have created structural vulnerabilities in the most widely held U.S. equity benchmark.
The tension between valuation measures underscores the debate among investors. The Shiller CAPE ratio's reading of 42 echoes conditions only once before in modern market history—just before the 2000 tech bubble collapsed—suggesting that current optimism may be excessive relative to long-term earnings power. Meanwhile, the forward price/earnings ratio of 21, while elevated by historical standards, is actually lower than the 2024 peak of 23.7, indicating some pullback in near-term expectations. This disagreement matters because it reflects different assumptions about whether today's high valuations are justified by future earnings growth or represent speculative excess.
The concentration risk is arguably more acute than valuation alone. With tech representing 40% of the index and the top 10 stocks accounting for nearly 40%, the S&P 500 has never been this dependent on a small cluster of holdings. Historically, such concentration has preceded sharp reversals when investor sentiment shifts. For investors holding broad S&P 500 ETFs, this means portfolio risk is no longer as diversified as the index's 500-stock composition might suggest.
For example, today's edition would include:
AI-summarized, only the topics you pick — one digest a day via Email, Slack, or Discord.
Free · takes 30 seconds · unsubscribe anytimeWhat is AIToday? →
Ask AI anything about this article. Q&As are published on this page for other readers too.
U.S. markets ended August higher, with the S&P 500 up 2.6% and the Nasdaq up 3.9%

Palantir Technologies stock has posted multi-year gains, including an 11x return over 3 years

CrowdStrike shares rose 5.77% on Monday, driven by investor excitement over its AI-powered cybersecurity growt…

Nvidia paused some deals under its AI financing program, which offered credit support to smaller AI cloud comp…
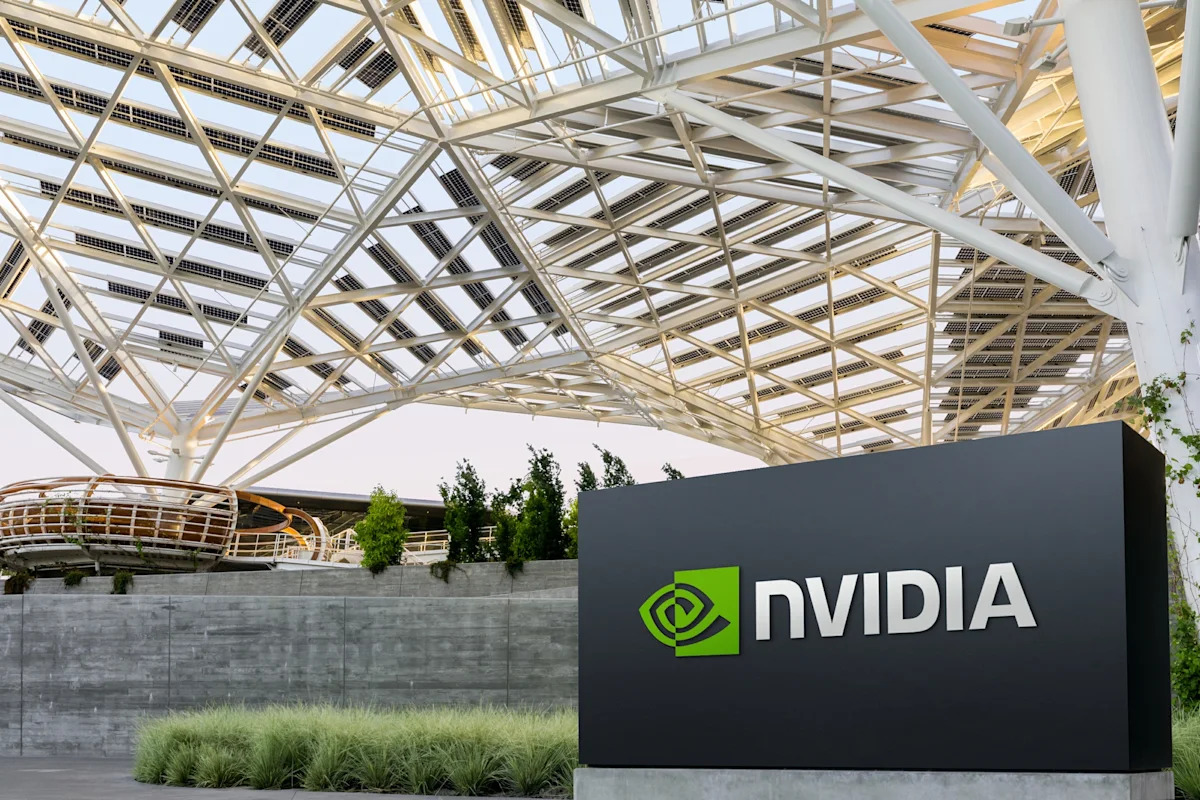
NVIDIA is now acting as a financier for its own demand, helping raise over $500 billion of third-party capital…
GE Vernova unveiled its medium-voltage uninterruptible power supply (MV-UPS) on August 24