What happened
Deepgram has introduced two capabilities for its speech-to-text and text-to-speech models on Amazon SageMaker AI: Deepgram Enhanced Metrics for billing and usage transparency, and Prometheus and OpenTelemetry support for engine-level and per-GPU visibility. Both are available today on Deepgram SageMaker AI deployments.
Why it matters
These innovations address the observability trade-off of self-hosted speech AI, giving you visibility into billing, feature usage, and engine behavior that was previously locked inside the vendor's container. They work within AWS Marketplace network isolation, so you can reconcile your AWS bill and monitor capacity without opening a network path or adding extra permissions.
What to watch
Detailed observability is on by default for newly created endpoints, publishing every 60 seconds. You can query the metrics with PromQL from CloudWatch, Grafana, or any Prometheus-compatible tool, and filter by endpoint, instance, or GPU.
Summaries like this, in your inbox every morning.
Deepgram's move addresses a long-standing pain point for self-hosted speech AI: the lack of visibility into what happens inside the vendor's container. Previously, you could see basic endpoint metrics like request counts, but not the billing units, feature usage, or engine behavior that drive capacity planning and cost management. By publishing these metrics into your own CloudWatch account, Deepgram lets you reconcile your AWS bill against actual traffic and understand which features your applications use, without compromising network isolation.
The two innovations complement each other. Deepgram Enhanced Metrics focus on billing and usage, answering questions like what you're billed for and how much streaming versus pre-recorded traffic you handle. The Prometheus and OpenTelemetry support goes deeper, offering per-GPU and host-level metrics that can reveal a saturated device hiding behind a summed average. Together, they provide a complete picture, from cost to engine headroom.
For teams running Deepgram on SageMaker AI, this could simplify compliance and cost governance. The billing stream cannot be disabled, ensuring a permanent audit trail, while the usage stream can be turned off if needed. As these metrics are standard CloudWatch metrics, you can build dashboards and set alarms, integrating AI operations into your existing monitoring workflows.
Pick your industry and the AI tools you use, and get news related to your work every day.
Free · 30 seconds with Google · unsubscribe anytimeWhat is AIToday? →
Ask AI anything about this article. The AI reads this article, earlier AIToday articles, and Wikipedia, and cites its sources. Q&As are published on this page for other readers too.
In Q2, billionaires or their funds sold six 'Magnificent Seven' AI stocks

Nvidia was rising early Friday, even as the wider chip sector kept falling, Barron's reported

ElevenLabs completed a $300 million employee tender at a $22 billion valuation, and co-founder Mati Staniszews…

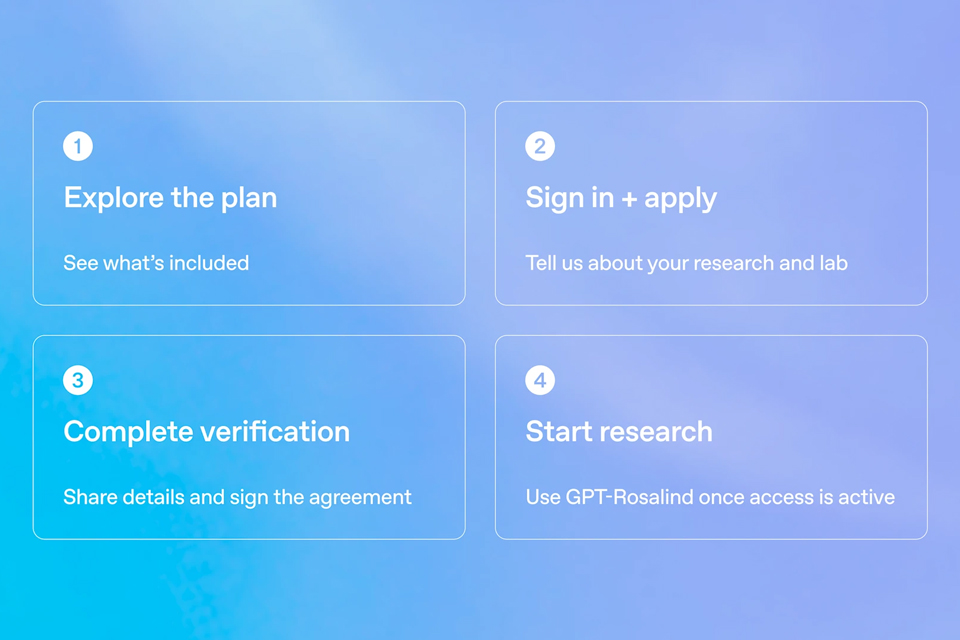
On October 15, OpenAI announced the Rosalind Academic Plan, giving approved US university labs free access to…
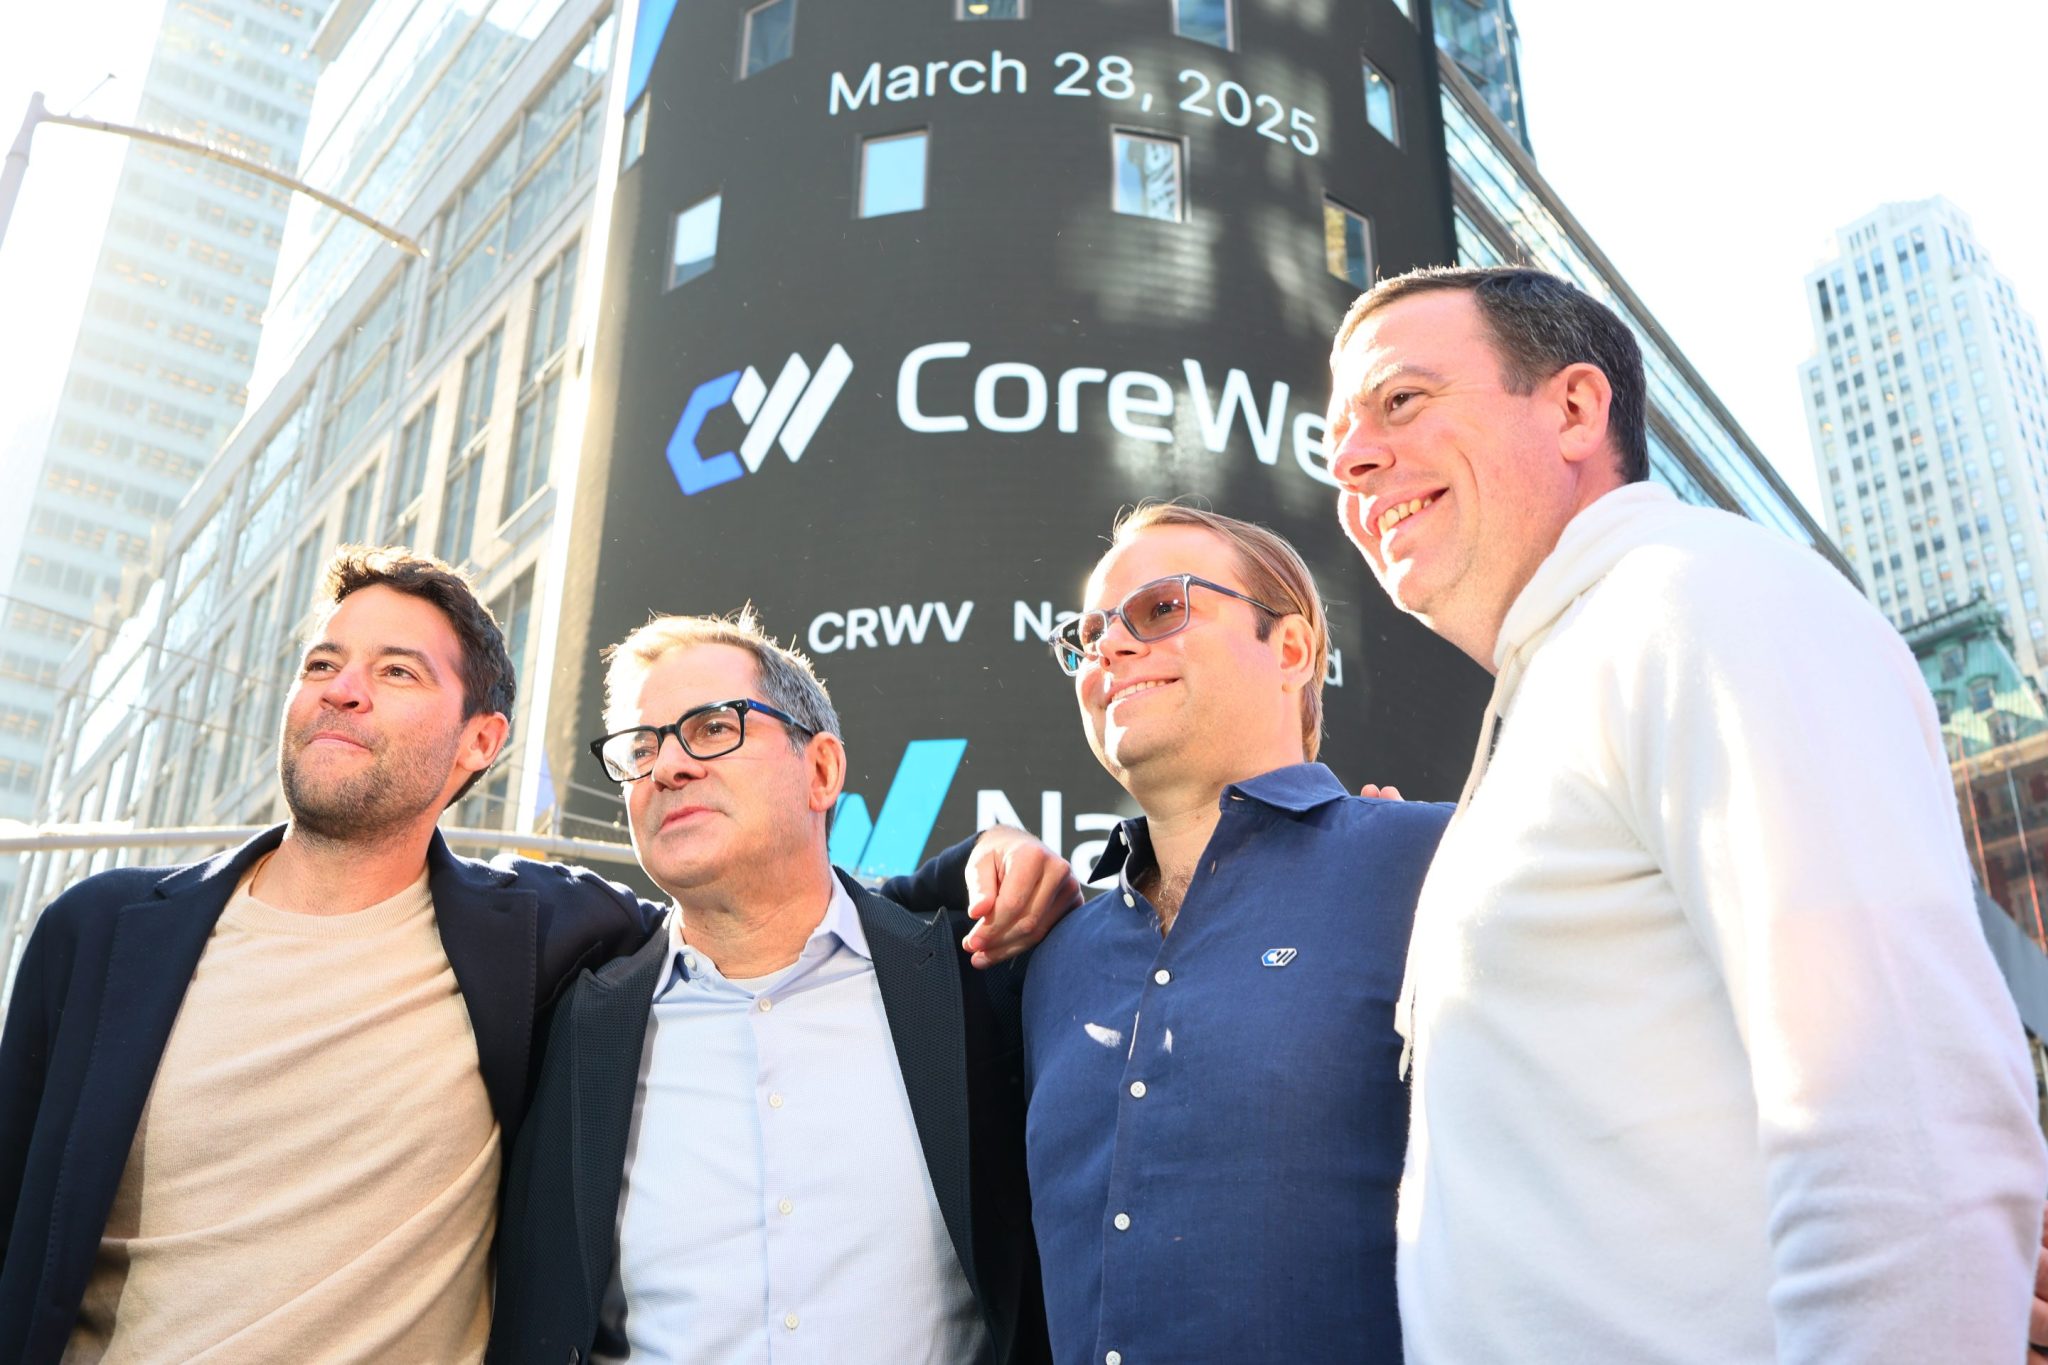
Neostellar Capital principal Evan Schlossman said CoreWeave's $103.7 billion in remaining performance obligati…
Supermicro Computer appointed Mark Long as chief financial officer, bringing an experienced technology finance…