What happened
Snowflake announced general availability of a redesigned Observe MCP (model context protocol) server and a new Observe CLI with full parity, allowing AI agents and engineers to query production telemetry directly through APIs, MCP, and command-line interfaces. The new MCP server connects agents directly to Observe's APIs instead of routing through an LLM intermediary.
Why it matters
As AI agents increasingly handle observability tasks—such as automatic alert triage, incident investigation, and error debugging—observability platforms must serve both humans and machines. The redesigned MCP server removes latency and cost by eliminating the previous LLM intermediary, enabling agents to reason about production data faster and more efficiently without passing through a reasoning layer.
What to watch
Both tools ship with prebuilt skills for common observability workflows (incident investigation, failure tracing, change validation, n+1 issue detection, outlier detection) and work immediately after configuration. General availability is rolling out now across all clusters; eu-2 and ca-1 regions will follow shortly.
Summaries like this, in your inbox every morning.
Observability has traditionally been a human-centric practice: engineers read dashboards, logs, and metrics to understand system behavior. As AI agents become capable of reasoning about operational data, observability platforms face a new demand: their data and capabilities must be accessible not just through graphical interfaces but through programmatic endpoints that agents can call autonomously. Snowflake's redesigned Observe MCP server and CLI represent a direct response to this shift.
The architectural change is significant: the original MCP server included a built-in LLM that received queries from agents, performed reasoning, and returned answers. This design incurred latency and cost overhead. The new server eliminates that intermediary, giving agents direct access to Observe's APIs—the same ones powering the UI. This means agents can explore the context graph, determine which data sets are most valuable, and write efficient OPAL queries without waiting for a reasoning layer to interpret their intent. The feedback from engineering teams already using agents with Observe shaped this redesign; several teams had built workarounds because programmatic access was limited, and specific use cases (updating dashboards, fetching chart images for reports, querying APM errors) required new platform capabilities.
The CLI achieving full parity with the MCP server ensures that the same operations available to agents are available to engineers working from the command line. Prebuilt skills for incident investigation, failure tracing, and outlier detection ship with both tools, allowing both humans and machines to use them immediately after configuration. This represents a foundational shift in how observability is consumed: not as a product for human inspection, but as a data platform accessible to the full stack of AI and developer tools a team relies on.
Pick your industry and the AI tools you use, and get news related to your work every day.
Free · 30 seconds with Google · unsubscribe anytimeWhat is AIToday? →
Ask AI anything about this article. The AI reads this article, earlier AIToday articles, and Wikipedia, and cites its sources. Q&As are published on this page for other readers too.
In Q2, billionaires or their funds sold six 'Magnificent Seven' AI stocks

Nvidia was rising early Friday, even as the wider chip sector kept falling, Barron's reported

ElevenLabs completed a $300 million employee tender at a $22 billion valuation, and co-founder Mati Staniszews…

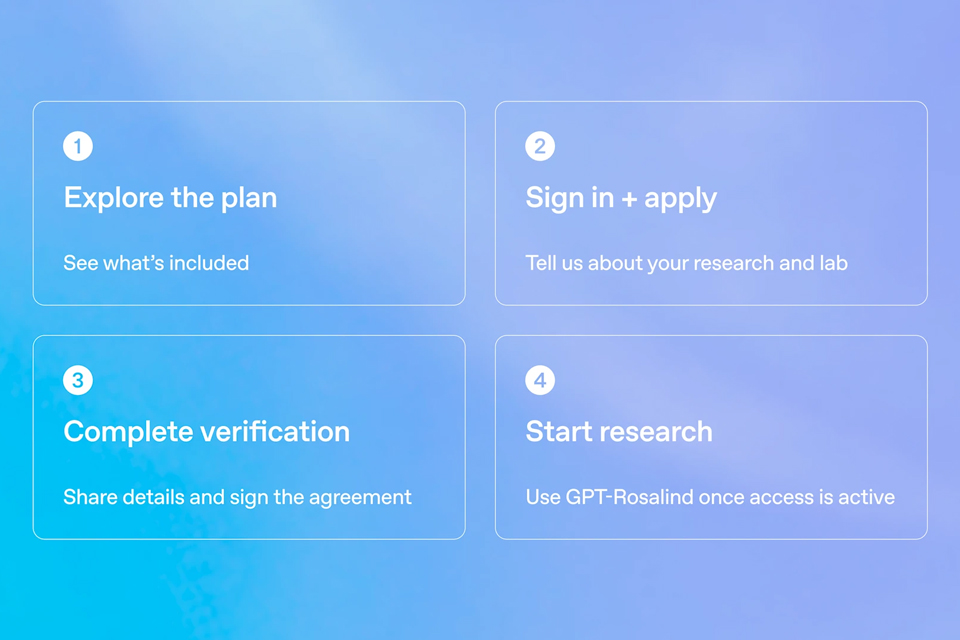
On October 15, OpenAI announced the Rosalind Academic Plan, giving approved US university labs free access to…
Neostellar Capital principal Evan Schlossman said CoreWeave's $103.7 billion in remaining performance obligati…
A Qiita article compared automated red-teaming methods for LLM apps — GCG, PAIR, and TAP — using mock implemen…