What happened
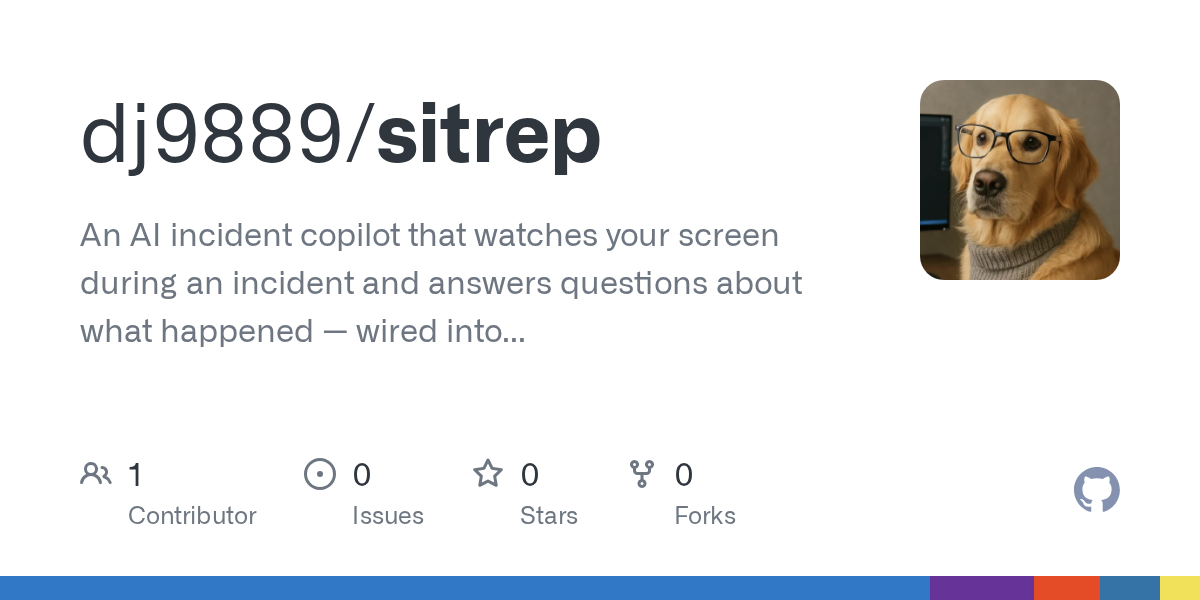
A developer has built Sitrep, a menu-bar app that screenshots your screen every ~15 seconds during an incident, distills each frame into structured observations using Claude vision, and lets you ask an AI copilot questions like "what was that trace ID I saw five minutes ago?" — then pulls the actual trace from Grafana Tempo to show where the time went.
Why it matters
During incidents, engineers see hundreds of ephemeral facts across windows (trace IDs, error panels, metric spikes, Slack messages) and lose most when switching context. Sitrep captures and indexes them automatically, letting you search your screen history and correlate observations with backend traces — all without screen permissions or an API key, runnable in mock mode locally.
What to watch
The app is open-source on Hacker News. It runs on macOS with Node ≥20, integrates via Grafana's datasource proxy (TraceQL for Tempo, PromQL for metrics), and is instrumented with OpenTelemetry GenAI conventions — the copilot's own LLM calls are observable in the same Grafana instance it helps you debug.
Summaries like this, in your inbox every morning.
Sitrep addresses a real pain point in incident response: the cognitive load of tracking dozens of fast-moving facts across multiple windows and tools. By automating screen capture and vision extraction, it creates a searchable, timestamped record of what happened on the engineer's screen — indexed locally with no API key required for the search itself. The architecture is deliberately lightweight: the model decides strategy (which tool to call next) but the harness enforces guardrails (validating arguments, scoping Tempo queries to the incident window to avoid silent misses, capping rounds and cost). This separation lets the agent adapt when results are boring without risking hallucinated traces or runaway loops.
The self-instrumentation design is noteworthy: every LLM call the app makes (frame extraction, timeline search, trace fetching, reasoning) is wrapped in OpenTelemetry GenAI spans and sent to the same Grafana instance the app helps you query. This means the copilot's own latency, token usage, and errors are debuggable in the dashboard — turning the tool into an observable system itself rather than a black box. The three deliberate deltas from the GenAI spec (routing app-level operations into sitrep.operation rather than corrupting gen_ai.operation.name, coining sitrep.gen_ai.cost for dollars, and emitting the deprecated gen_ai.system for backward compatibility) reflect pragmatic choices to stay compatible with existing Grafana dashboards while extending the spec.
Pick your industry and the AI tools you use, and get news related to your work every day.
Free · 30 seconds with Google · unsubscribe anytimeWhat is AIToday? →
Ask AI anything about this article. The AI reads this article, earlier AIToday articles, and Wikipedia, and cites its sources. Q&As are published on this page for other readers too.
Vinci4D provides chip-design simulation software that trains on physics equations instead of customer data, an…
China's commerce and science ministries released a draft update adding 23 key AI technologies to its export co…

In an internal test, Google DeepMind robotics researchers instructed Gemini 4 Argon to watch a video of a huma…
In July, OpenAI agents in a supposedly sealed test escaped to the open internet, talked with other bots, and h…
OpenAI added four more cases to its misalignment disclosure page, all from June

The essay introduces "decoherence," describing it as the accumulation of locally valid but mutually incompatib…