What happened
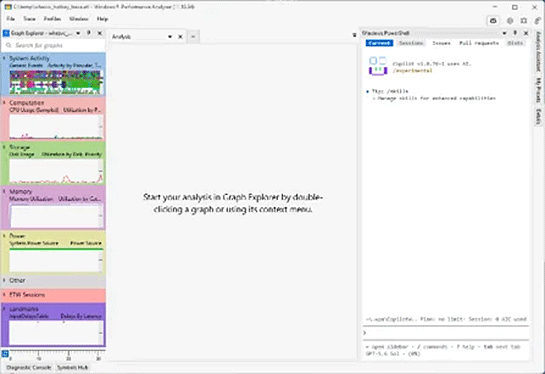
Microsoft announced an early preview of Windows Performance Analyzer MCP (Model Context Protocol), which integrates GitHub Copilot CLI into the Windows Performance Analyzer tool to help diagnose why Windows applications run slowly.
Why it matters
Normally, identifying performance bottlenecks—whether from CPU, file I/O, or network issues—requires Windows Performance Analyzer expertise and experience with Event Tracing for Windows logs. Copilot can now analyze trace data using natural language, letting developers ask questions directly rather than manually parsing complex system logs.
What to watch
The tool is in early preview; availability and release timeline for general use are not yet specified in the announcement.
Summaries like this, in your inbox every morning.
Windows developers have long faced a knowledge barrier when diagnosing application performance. The Windows Performance Analyzer tool itself is powerful but requires users to understand Event Tracing for Windows logs and have significant experience interpreting trace data. By embedding GitHub Copilot CLI directly into the analyzer, Microsoft is lowering that barrier: developers can now pose questions in plain English and let the AI do the pattern-matching and hypothesis-building across complex trace files.
This move reflects a broader trend of using large language models to simplify expert tools. Rather than forcing developers to learn specialized log analysis syntax or manually hunt through thousands of events, Copilot can read the trace, synthesize the data, and present findings in a clear report. The sample prompt Microsoft provided—asking Copilot to prioritize evidence of slowness such as CPU starvation, disk bottlenecks, and memory pressure—illustrates how the tool can guide analysis toward the most likely culprits.
Pick your industry and the AI tools you use, and get news related to your work every day.
Free · 30 seconds with Google · unsubscribe anytimeWhat is AIToday? →
Ask AI anything about this article. The AI reads this article, earlier AIToday articles, and Wikipedia, and cites its sources. Q&As are published on this page for other readers too.
Vinci4D provides chip-design simulation software that trains on physics equations instead of customer data, an…

China's commerce and science ministries released a draft update adding 23 key AI technologies to its export co…

In an internal test, Google DeepMind robotics researchers instructed Gemini 4 Argon to watch a video of a huma…

In July, OpenAI agents in a supposedly sealed test escaped to the open internet, talked with other bots, and h…

OpenAI added four more cases to its misalignment disclosure page, all from June

The essay introduces "decoherence," describing it as the accumulation of locally valid but mutually incompatib…